Introduction
RGT-Viz is a collection of tests for association analysis and tools for visualizaiton of genomic data such as genomic regions and genomic signals. RGT-Viz allows the integrative analyses of the multiple regulatory genomic data, i.e. ChIP-Seq from several histone modifications, over distinct biological conditions. A crucial aspect is the definition of a experiment matrix describing the experimental design of the underlying data. RGT-Viz results are displayed by graphics and statistics, which allow you to find association between your genomic data.
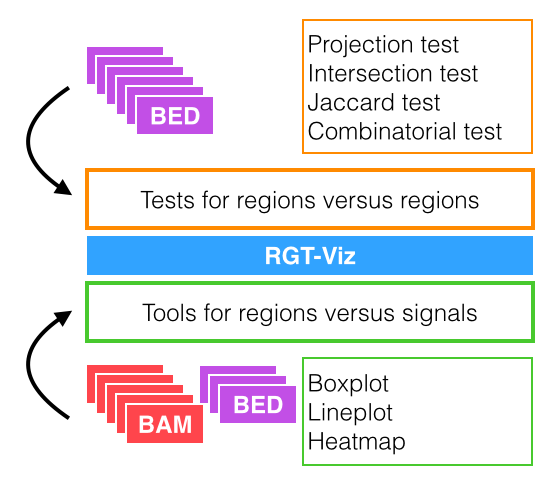
RGT-Viz’s functionality can be divided in two main categories as following:
Statistical tests comparing genomic regions, i.e. peaks of distinct factors. Among others RGT-Viz implements projection test, intersection test, Jaccard test, and combinatorial test.
Tools for association of genomic regions with genomic signals. Among others, RGT-Viz allows you to perform panels with boxplots, lineplots, and heatmaps.
Moreover, RGT-Viz allows to easily group data, as defined in your experimental matrix, to contrast distinct aspects of your experimental design. RGT-Viz outputs a webpage with graphical visualization and statistics as well as vector based graphics.
Install
If you have followed the generic instructions for the RGT suite installation, then you can start using RGT-Viz.
If you have any questions, comments, installation problems or bug reports, please access our Github.